Results of the AKM Video Meteor Network - February 2004
=======================================================
After 2004 started with only some clear skies, the weather did not improve
significantly in February. Even though the number of observing nights
increased to a maximum of 15 per observer, the effective observing time
remained almost the same. Again it is only thanks to the good distribution
of the few clear nights per observer that we lost just one observing night
in February.
The number of detected meteors decreased due to reduced meteor activity and
shorter nights. Fewer than 700 meteors were recorded in Summer 2000 for the
last time.
After I received the last observations in February, I could finish the annual
statistics for 2003. The following table shows the distribution of the
observations throughout the year. The "summer of the century" is reflected by
the fact, that in the six months from April to September only a single
observing night was missed. Overall the were only nine nights without
observations in 2003.
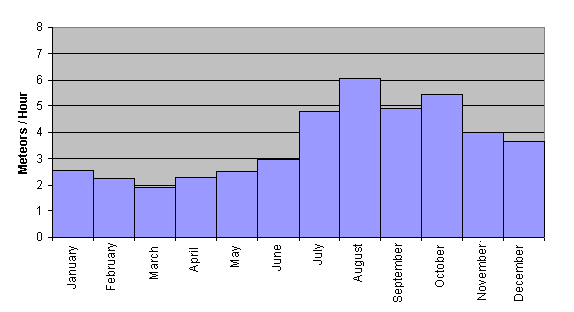
Month Observing Coverage Observ. Meteors Meteors/
Nights Time Hour
---------------------------------------------------------
January 30 96.8% 646.0 1647 2.5
February 27 96.4% 928.9 2064 2.2
March 30 96.8% 895.2 1722 1.9
April 30 100.0% 794.0 1832 2.3
May 30 96.8% 519.9 1311 2.5
June 30 100.0% 518.1 1526 2.9
July 31 100.0% 662.3 3172 4.8
August 31 100.0% 1126.2 6821 6.1
September 30 100.0% 1010.7 4965 4.9
October 30 96.8% 922.8 5004 5.4
November 28 93.3% 620.5 2492 4.0
December 29 93.5% 925.1 3383 3.7
---------------------------------------------------------
Overall 356 97.5% 9408.1 35939 3.8
The effective observing time and the number of recorded meteors reached their
maxima in August, September and October. In the first two months we could
collect more than 1,000 observing hours. If the number of meteors is
normalized by the effective observing time, we end up with a nearly perfect
sinusoidal pattern of annual meteor activity with a minimum in spring and a
maximum in fall.
 The second table shows the results of the individual video observers in 2003.
Whereas our Australian observers dominated in the previous years, we see three
German observers on top of the list in this year thanks to the unusual weather.
Two of them even managed to achieve an observing night coverage of more than
60%, more than ever one before.
Name Observing Coverage Observ. Meteors Meteors/
Nights Time Hour
-----------------------------------------------------------------
Sirko Molau 233 63.8% 2028.3 11253 5.5
Joerg Strunk 222 60.8% 1729.6 5199 3.0
Juergen Rendtel 164 44.9% 974.3 3820 3.9
Steve Quirk 159 43.6% 1400.6 5480 3.9
Stane Slavec 141 38.6% 867.4 2352 2.7
Ilkka Yrjola 108 29.6% 718.5 1571 2.2
Detlef Koschny 87 23.8% 579.4 2569 4.4
Orlando Benitez-S. 50 13.7% 320.0 754 2.4
Ulrich Sperberg 29 7.9% 194.0 635 3.3
Mirko Nitschke 29 7.9% 132.8 266 2.0
Stephen Evans 25 6.8% 96.4 435 4.5
Andre Knoefel 19 5.2% 113.5 197 1.7
Stefan Ueberschaer 18 4.9% 93.5 157 1.7
Rosta Stork 16 4.4% 253.3 1140 4.5
Javor Kac 11 3.0% 68.1 111 1.6
-----------------------------------------------------------------
The video database of the camera network, which is available at www.metrec.org,
has been updated recently. Thereby the number of datasets almost doubled. Now
the database contains all observations until the end of 2003 (only some
Australian observations are still missing). Overall, information on more than
106,000 meteors from 1,350 observing nights are stored in PosDat format. With
a few clicks of your mouse you can load the data into the Radiant software
and analyse major and minor meteor showers.
1. Observers
============
Code Name Place Camera FOV LM Nights Time Meteors
--------------------------------------------------------------------------------
EVAST Evans Moreton RF1 (1.2/12) 20 dg 4 mag 4 41.4 h 29
KACJA Kac Konstanjevec METKA (0.8/8) 42 dg 2 mag 8 60.3 h 23
MOLSI Molau Seysdorf AVIS (2.0/35) 40 dg 5 mag 7 46.7 h 167
AKM1 (0.85/25) 32 dg 6 mag 6 8.2 h 22
MINCAM1 (1.4/12) 35 dg 4 mag 9 61.8 h 79
SLAST Slavec Ljubljana KAYAK1 (1.8/28) 50 dg 4 mag 8 74.5 h 105
STRJO Strunk Leopoldshoehe MINCAM2 (0.8/8) 42 dg 4 mag 11 57.1 h 115
UEBST Ueberschaer Aachen MIMO (0.95/25) 13 dg 4 mag 3 19.1 h 9
YRJIL Yrjola Kuusankoski FINEXCAM (0.8/6) 38 dg 4 mag 11 74.7 h 103
--------------------------------------------------------------------------------
Sum 28 444.3 h 652
2. Observing Times (h)
======================
Feb 01 02 03 04 05 06 07 08 09 10 11 12 13 14 15
--------------------------------------------------------------------------------
EVAST - - - - - - - 10.9 - - - - - - -
KACJA 6.1 - - - - 7.3 - 10.8 6.1 - - 6.1 7.9 9.9 -
MOLSI - - - - - - - - - - 7.8 - - - -
0.6 - 1.2 3.8 1.2 1.3 0.6 - - - - - - - -
- - - - - - - - - - 7.1 - - - 0.3
SLAST 10.7 - - 7.8 - - - - 10.2 1.8 - - 10.2 11.1 11.0
STRJO - - - - - - - - - - 0.5 - - - 2.7
UEBST - - 7.4 - - - - - - - - - - - -
YRJIL - - - - - - 2.5 - 9.9 - 12.3 12.2 2.5 - 3.1
--------------------------------------------------------------------------------
Sum 17.4 - 8.6 11.6 1.2 8.6 3.1 21.7 26.2 1.8 27.7 18.3 20.6 21.0 17.1
Feb 16 17 18 19 20 21 22 23 24 25 26 27 28 29
---------------------------------------------------------------------------
EVAST - - - - - - 10.3 - - 10.1 - - 10.1 -
KACJA - 6.1 - - - - - - - - - - - -
MOLSI 10.1 5.1 - 8.7 6.4 - - - 6.5 - - - - 2.1
- - - - - - - - - - - - - -
12.1 5.0 - 10.8 11.8 - - - 11.8 - - 1.6 - 1.3
SLAST - 11.7 - - - - - - - - - - - -
STRJO - - 1.2 11.5 10.5 1.5 10.0 11.3 - 2.2 - - 0.9 4.8
UEBST - - - - - - - - - - 5.8 - - 5.9
YRJIL 6.6 - 9.7 - 5.6 9.0 - 1.3 - - - - - -
---------------------------------------------------------------------------
Sum 28.8 27.9 10.9 31.0 34.3 10.5 20.3 12.6 18.3 12.3 5.8 1.6 11.0 14.1
3. Results (Meteors)
====================
Feb 01 02 03 04 05 06 07 08 09 10 11 12 13 14 15
--------------------------------------------------------------------------------
EVAST - - - - - - - 10 - - - - - - -
KACJA 1 - - - - 1 - 4 7 - - 3 5 1 -
MOLSI - - - - - - - - - - 35 - - - -
1 - 4 9 3 3 2 - - - - - - - -
- - - - - - - - - - 21 - - - 1
SLAST 11 - - 12 - - - - 17 2 - - 16 15 18
STRJO - - - - - - - - - - 2 - - - 3
UEBST - - 3 - - - - - - - - - - - -
YRJIL - - - - - - 5 - 8 - 20 10 1 - 10
--------------------------------------------------------------------------------
Sum 13 - 7 21 3 4 7 14 32 2 78 13 22 16 32
Feb 16 17 18 19 20 21 22 23 24 25 26 27 28 29
---------------------------------------------------------------------------
EVAST - - - - - - 8 - - 7 - - 4 -
KACJA - 1 - - - - - - - - - - - -
MOLSI 36 3 - 36 28 - - - 25 - - - - 4
- - - - - - - - - - - - - -
21 1 - 11 8 - - - 12 - - 2 - 2
SLAST - 14 - - - - - - - - - - - -
STRJO - - 4 23 19 3 18 20 - 7 - - 3 13
UEBST - - - - - - - - - - 4 - - 2
YRJIL 11 - 13 - 14 10 - 1 - - - - - -
---------------------------------------------------------------------------
Sum 68 19 17 70 69 13 26 21 37 14 4 2 7 21
Sirko Molau, 2004/03/25
The second table shows the results of the individual video observers in 2003.
Whereas our Australian observers dominated in the previous years, we see three
German observers on top of the list in this year thanks to the unusual weather.
Two of them even managed to achieve an observing night coverage of more than
60%, more than ever one before.
Name Observing Coverage Observ. Meteors Meteors/
Nights Time Hour
-----------------------------------------------------------------
Sirko Molau 233 63.8% 2028.3 11253 5.5
Joerg Strunk 222 60.8% 1729.6 5199 3.0
Juergen Rendtel 164 44.9% 974.3 3820 3.9
Steve Quirk 159 43.6% 1400.6 5480 3.9
Stane Slavec 141 38.6% 867.4 2352 2.7
Ilkka Yrjola 108 29.6% 718.5 1571 2.2
Detlef Koschny 87 23.8% 579.4 2569 4.4
Orlando Benitez-S. 50 13.7% 320.0 754 2.4
Ulrich Sperberg 29 7.9% 194.0 635 3.3
Mirko Nitschke 29 7.9% 132.8 266 2.0
Stephen Evans 25 6.8% 96.4 435 4.5
Andre Knoefel 19 5.2% 113.5 197 1.7
Stefan Ueberschaer 18 4.9% 93.5 157 1.7
Rosta Stork 16 4.4% 253.3 1140 4.5
Javor Kac 11 3.0% 68.1 111 1.6
-----------------------------------------------------------------
The video database of the camera network, which is available at www.metrec.org,
has been updated recently. Thereby the number of datasets almost doubled. Now
the database contains all observations until the end of 2003 (only some
Australian observations are still missing). Overall, information on more than
106,000 meteors from 1,350 observing nights are stored in PosDat format. With
a few clicks of your mouse you can load the data into the Radiant software
and analyse major and minor meteor showers.
1. Observers
============
Code Name Place Camera FOV LM Nights Time Meteors
--------------------------------------------------------------------------------
EVAST Evans Moreton RF1 (1.2/12) 20 dg 4 mag 4 41.4 h 29
KACJA Kac Konstanjevec METKA (0.8/8) 42 dg 2 mag 8 60.3 h 23
MOLSI Molau Seysdorf AVIS (2.0/35) 40 dg 5 mag 7 46.7 h 167
AKM1 (0.85/25) 32 dg 6 mag 6 8.2 h 22
MINCAM1 (1.4/12) 35 dg 4 mag 9 61.8 h 79
SLAST Slavec Ljubljana KAYAK1 (1.8/28) 50 dg 4 mag 8 74.5 h 105
STRJO Strunk Leopoldshoehe MINCAM2 (0.8/8) 42 dg 4 mag 11 57.1 h 115
UEBST Ueberschaer Aachen MIMO (0.95/25) 13 dg 4 mag 3 19.1 h 9
YRJIL Yrjola Kuusankoski FINEXCAM (0.8/6) 38 dg 4 mag 11 74.7 h 103
--------------------------------------------------------------------------------
Sum 28 444.3 h 652
2. Observing Times (h)
======================
Feb 01 02 03 04 05 06 07 08 09 10 11 12 13 14 15
--------------------------------------------------------------------------------
EVAST - - - - - - - 10.9 - - - - - - -
KACJA 6.1 - - - - 7.3 - 10.8 6.1 - - 6.1 7.9 9.9 -
MOLSI - - - - - - - - - - 7.8 - - - -
0.6 - 1.2 3.8 1.2 1.3 0.6 - - - - - - - -
- - - - - - - - - - 7.1 - - - 0.3
SLAST 10.7 - - 7.8 - - - - 10.2 1.8 - - 10.2 11.1 11.0
STRJO - - - - - - - - - - 0.5 - - - 2.7
UEBST - - 7.4 - - - - - - - - - - - -
YRJIL - - - - - - 2.5 - 9.9 - 12.3 12.2 2.5 - 3.1
--------------------------------------------------------------------------------
Sum 17.4 - 8.6 11.6 1.2 8.6 3.1 21.7 26.2 1.8 27.7 18.3 20.6 21.0 17.1
Feb 16 17 18 19 20 21 22 23 24 25 26 27 28 29
---------------------------------------------------------------------------
EVAST - - - - - - 10.3 - - 10.1 - - 10.1 -
KACJA - 6.1 - - - - - - - - - - - -
MOLSI 10.1 5.1 - 8.7 6.4 - - - 6.5 - - - - 2.1
- - - - - - - - - - - - - -
12.1 5.0 - 10.8 11.8 - - - 11.8 - - 1.6 - 1.3
SLAST - 11.7 - - - - - - - - - - - -
STRJO - - 1.2 11.5 10.5 1.5 10.0 11.3 - 2.2 - - 0.9 4.8
UEBST - - - - - - - - - - 5.8 - - 5.9
YRJIL 6.6 - 9.7 - 5.6 9.0 - 1.3 - - - - - -
---------------------------------------------------------------------------
Sum 28.8 27.9 10.9 31.0 34.3 10.5 20.3 12.6 18.3 12.3 5.8 1.6 11.0 14.1
3. Results (Meteors)
====================
Feb 01 02 03 04 05 06 07 08 09 10 11 12 13 14 15
--------------------------------------------------------------------------------
EVAST - - - - - - - 10 - - - - - - -
KACJA 1 - - - - 1 - 4 7 - - 3 5 1 -
MOLSI - - - - - - - - - - 35 - - - -
1 - 4 9 3 3 2 - - - - - - - -
- - - - - - - - - - 21 - - - 1
SLAST 11 - - 12 - - - - 17 2 - - 16 15 18
STRJO - - - - - - - - - - 2 - - - 3
UEBST - - 3 - - - - - - - - - - - -
YRJIL - - - - - - 5 - 8 - 20 10 1 - 10
--------------------------------------------------------------------------------
Sum 13 - 7 21 3 4 7 14 32 2 78 13 22 16 32
Feb 16 17 18 19 20 21 22 23 24 25 26 27 28 29
---------------------------------------------------------------------------
EVAST - - - - - - 8 - - 7 - - 4 -
KACJA - 1 - - - - - - - - - - - -
MOLSI 36 3 - 36 28 - - - 25 - - - - 4
- - - - - - - - - - - - - -
21 1 - 11 8 - - - 12 - - 2 - 2
SLAST - 14 - - - - - - - - - - - -
STRJO - - 4 23 19 3 18 20 - 7 - - 3 13
UEBST - - - - - - - - - - 4 - - 2
YRJIL 11 - 13 - 14 10 - 1 - - - - - -
---------------------------------------------------------------------------
Sum 68 19 17 70 69 13 26 21 37 14 4 2 7 21
Sirko Molau, 2004/03/25